On June 1, 2020, the Cabinet Committee on Economic Affairs approved a revision in the definition of Micro, Small and Medium Enterprises (MSMEs).[1] In this blog, we discuss the change in the definition as approved by the Cabinet, and examine some of the common criteria used for classification of MSMEs.
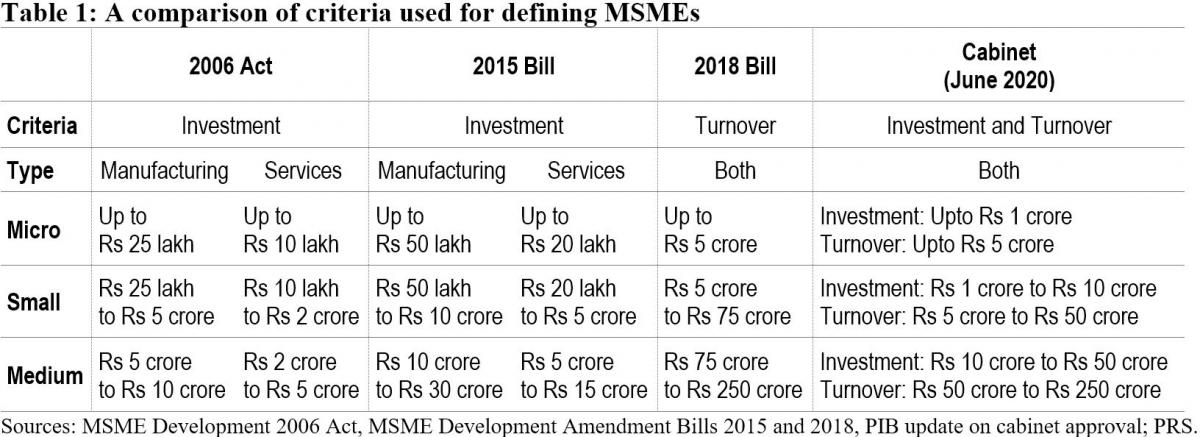
Currently, MSMEs are defined under the Micro, Small and Medium Enterprises Development Act, 2006.[2] The Act classifies them as micro, small and medium enterprises based on: (i) investment in plant and machinery for enterprises engaged in manufacturing or production of goods, and (ii) investment in equipment for enterprises providing services. As per the Cabinet approval, the investment limits will be revised upwards and annual turnover of the enterprise will be used as additional criteria for the classification of MSMEs (Table 1).
Earlier attempts to amend the definition of MSMEs
The central government has sought to revise the definition of MSMEs in the Act on two earlier occasions. The government introduced the MSME Development (Amendment) Bill, 2015 which proposed to increase the investment limits for manufacturing and services MSMEs.[3] This Bill was withdrawn in July 2018 and another Bill was introduced. The MSME Development (Amendment) Bill, 2018 proposed to: (i) use annual turnover as criteria instead of investment for classification of MSMEs, (ii) remove the distinction between manufacturing and services, and (iii) provide the central government with the power to revise the turnover limits, through a notification.[4] The 2018 Bill lapsed with the dissolution of 16th Lok Sabha.
Global trends in criteria for the classification of MSMEs
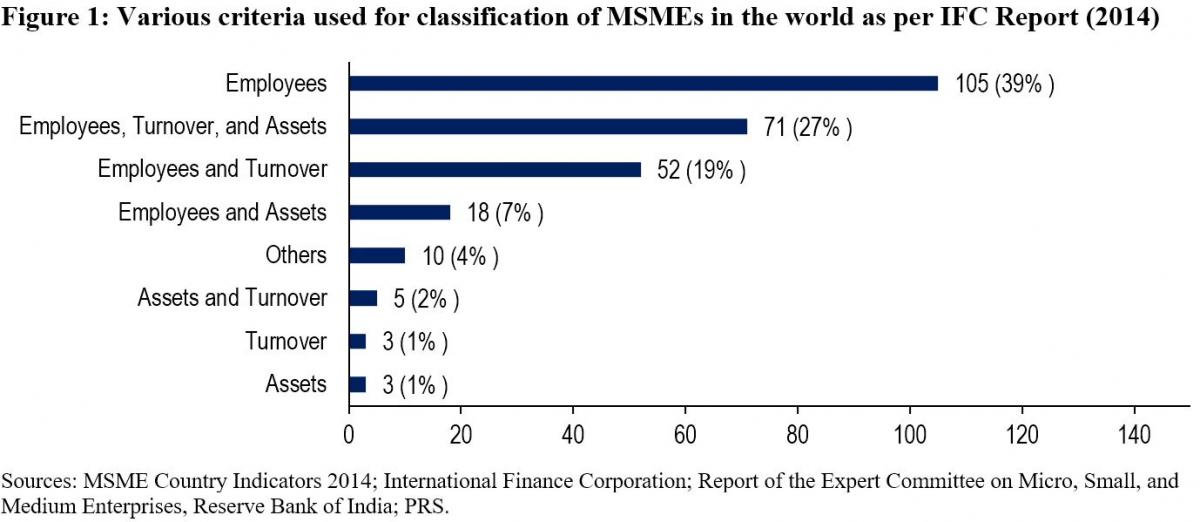
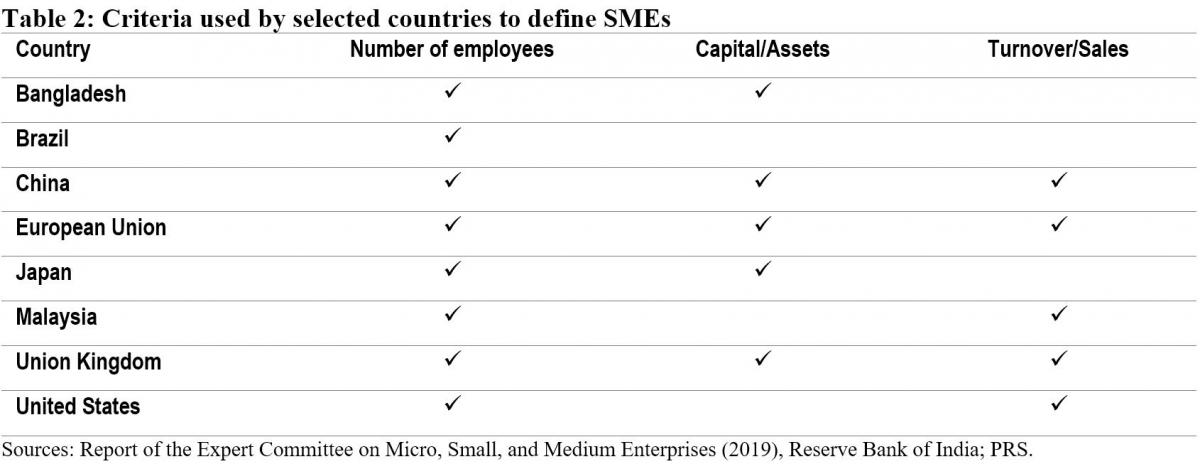
While India will now be using investment and annual turnover as the criteria to classify MSMEs, globally, the number of employees is the most widely used criteria for classifying MSMEs. The Reserve Bank of India's Expert Committee on MSMEs (2019) cited a study by the International Finance Corporation in 2014 which analysed 267 definitions used by different institutions in 155 countries.[5],[6] According to the study, countries used a combination of criteria to classify MSMEs. 92% of the definitions used the number of employees as one of the criteria. Other frequently used criteria were: (i) turnover (49%), and (ii) value of assets (36%). 11% of the analysed definitions used alternative criteria such as: (i) loan size, (ii) years of experience, and (iii) initial investment.
Evaluation of common criteria used to define MSMEs
Investment: The 2006 Act uses investment in plant, machinery, and equipment to classify MSMEs. Some of the issues with the investment criteria include:
Due to their informal and small scale of operations, firms often do not maintain proper books of accounts and hence find it difficult to get classified as MSMEs as per the current definition.5
The investment-based classification incentivises promoters to keep the investment size restricted to retain the benefits associated with the micro or small category.7
Turnover: The 2018 Bill sought to replace the investment criteria with annual turnover as the sole criteria for the classification of MSMEs. The Standing Committee agreed with the proposal under the Bill to use annual turnover as the criteria instead of investment.7 It observed that this could overcome some of the shortcomings of classification based on investment. While turnover based criteria will also require verification, the Committee noted that the GST Network (GSTN) data can act as a reliable source of information for this purpose. However, it also observed that:7
With turnover as a criterion for classification, corporates may misuse the incentives meant for MSMEs. For instance, there is a possibility that a multi-national company may produce a large quantity of products worth a high turnover and then market it through various subsidiaries registered as Micro or Small enterprise under GSTN.
The turnover of some enterprises may fluctuate depending on their business, which may result in the change of classification of the enterprise during a year.
The Committee noted that there is a wide gap in turnover limits. For instance, an enterprise with a turnover of Rs 6 crore and an enterprise with a turnover of Rs 75 crore (as proposed in 2018 Bill) would both be classified as a small enterprise, which seems incongruous.
The Expert Committee (RBI) also recommended using annual turnover as the criteria for classification instead of investment.5 It observed that turnover based definition would be transparent, progressive, and easier to implement through the GSTN. It also recommended that the power to change the definition of MSMEs should be delegated to the executive as it will help in responding to changing economic scenarios.
Number of employees: The Standing Committee had highlighted that in a labour-intensive country like India, appropriate focus is required on employment generation and MSME sector is the most suitable platform for this.7 It had recommended that the central government should assess the number of persons employed in the MSME sector and also consider employment as a criterion while classifying MSMEs. However, the Expert Committee (RBI) stated that while the employment-based definition is an additional feature preferred in some countries, the definition would pose challenges in implementation.5 According to the Ministry of MSME, employment as a criterion has problems due to: (i) factors such as seasonality and informal nature of engagement, (ii) similar to investment criteria, this would also require physical verification and has associated cost overheads.7
Number of MSMEs
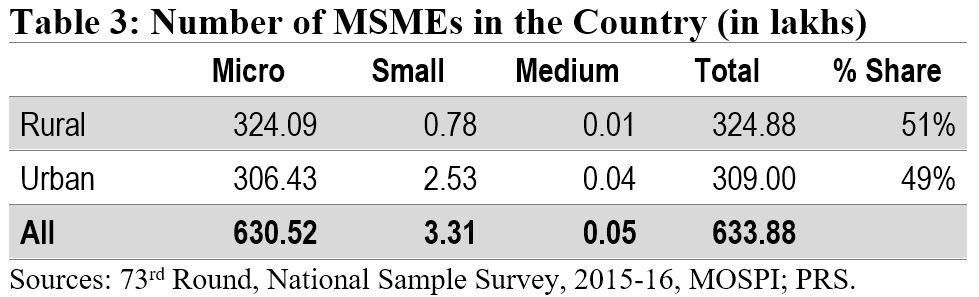
According to the National Sample Survey (2015-16), there were around 6.34 crore MSMEs in the country. The micro sector with 6.3 crore enterprises accounted for more than 99% of the total estimated number of MSMEs. The small and medium sectors accounted for only 0.52% and 0.01% of the estimated number of enterprises, respectively. Another dataset to understand the distribution of MSMEs is Udyog Aadhaar, a unique identity provided by the Unique Identification Authority of India (UIDAI) to MSME enterprises.[8] Udyog Aadhaar registration is based on self-declaration by enterprises. Between September 2015 and June 2020, 98.6 lakh enterprises have registered with UIDAI. According to this dataset, micro, small, and medium enterprises comprise 87.7%, 11.8% and 0.5% of the MSME sector respectively.
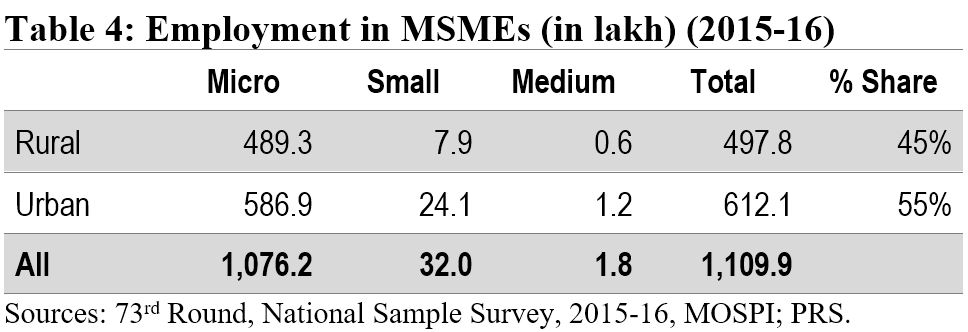
Employment in the MSME sector
The MSME sector employed nearly 11.1 crore people in 2015-16. The sector was the second largest employer after the agriculture sector. The highest number of employed persons were engaged in trade activity (35%), followed by persons engaged in manufacturing (32%).
Implications of change in the definition of MSMEs
The change in the definition of MSMEs may result in many enterprises which are currently classified as Small enterprises be reclassified as Micro, and those classified as Medium enterprises be reclassified as Small. Further, there may be many enterprises which are not currently classified as MSMEs, which may fall under the MSME classification as per the new definition. Such enterprises will also now benefit from the schemes related to MSMEs. The Ministry of MSME runs various schemes to provide for: (i) flow of credit to MSMEs, (ii) support for technology upgrade and modernisation, (iii) entrepreneurship and skill development, and (iv) cluster-wise measures to promote capacity-building and empowerment of MSME units. For instance, under the Credit Guarantee Fund Scheme for Micro and Small Enterprises, a credit guarantee cover of up to 75% of the credit is provided to micro and small enterprises.[9] Thus, the re-classification may require a significant increase in budgetary allocation for the MSME sector.
Other announcements related to MSMEs in the aftermath of COVID-19
MSME sector accounted for nearly 33.4% of the total manufacturing output in 2017-18.[10] During the same year, its share in the country’s total exports was around 49%. Between 2015 and 2017, the contribution of the sector in GDP has been around 30%. Due to the national lockdown induced by COVID-19, businesses including MSMEs have been badly hit. To provide immediate relief to the MSME sector, the government announced several measures in May 2020.[11] These include: (i) collateral-free loans for MSMEs with up to Rs 25 crore outstanding and up to Rs 100 crore turnover, (ii) Rs 20,000 crore as subordinate debt for stressed MSMEs, and (iii) Rs 50,000 crore of capital infusion into MSMEs. These measures have also been approved by the Union Cabinet.[12]
For more details on the announcements made under the Aatma Nirbhar Bharat Abhiyan, see here.
[1] “Cabinet approves Upward revision of MSME definition and modalities/ road map for implementing remaining two Packages for MSMEs (a)Rs 20000 crore package for Distressed MSMEs and (b) Rs 50,000 crore equity infusion through Fund of Funds”, Press Information Bureau, Cabinet Committee on Economic Affairs, June 1, 2020.
[2] The Micro, Small and Medium Enterprises Development Act, 2006, https://samadhaan.msme.gov.in/WriteReadData/DocumentFile/MSMED2006act.pdf.
[3] The Micro, Small and Medium Enterprises Development (Amendment) Bill, 2015, https://www.prsindia.org/sites/default/files/bill_files/MSME_bill%2C_2015_0.pdf.
[4] The Micro, Small and Medium Enterprises Development (Amendment) Bill, 2018, https://www.prsindia.org/sites/default/files/bill_files/The%20Micro%2C%20Small%20and%20Medium%20Enterprises%20Development%20%28Amendment%29%20Bill%2C%202018%20Bill%20Text.pdf.
[5] Report of the Expert Committee on Micro, Small and Medium Enterprises, The Reserve Bank of India, July 2019, https://rbidocs.rbi.org.in/rdocs/PublicationReport/Pdfs/MSMES24062019465CF8CB30594AC29A7A010E8A2A034C.PDF.
[6] MSME Country Indicators 2014, International Finance Corporation, December 2014, https://www.smefinanceforum.org/sites/default/files/analysis%20note.pdf.
[7] 294th Report on Micro Small and Medium Enterprises Development (Amendment) Bill 2018, Standing Committee on Industry, Rajya Sabha, December 2018, https://rajyasabha.nic.in/rsnew/Committee_site/Committee_File/ReportFile/17/111/294_2019_3_15.pdf.
[8] Enterprises with Udyog Aadhaar Number, National Portal for Registration of Micro, Small & Medium Enterprises, Ministry of Micro, Small and Medium Enterprises, https://udyogaadhaar.gov.in/UA/Reports/StateBasedReport_R3.aspx.
[9] Credit Guarantee Fund Scheme for Micro and Small Enterprises, Ministry of Micro, Small and Medium Enterprises, http://www.dcmsme.gov.in/schemes/sccrguarn.htm.
[10] Annual Report 2018-19, Ministry of Micro, Small and Medium Enterprises, https://msme.gov.in/sites/default/files/Annualrprt.pdf.
[11] "Finance Minister announce measures for relief and credit support related to businesses, especially MSMEs to support Indian Economy’s fight against COVID-19", Press Information Bureau, Ministry of Finance, May 13, 2020.
[12] "Cabinet approves additional funding of up to Rupees three lakh crore through introduction of Emergency Credit Line Guarantee Scheme (ECLGS)", Press Information Bureau, Ministry of Finance, May 20, 2020.
Early this week, the Comptroller and Auditor General (CAG) of India tabled a report on the finances of Uttar Pradesh for the financial year 2020-21. A few days prior to that, on May 26, the budget for Uttar Pradesh for 2022-23 was presented, along with which the final audited expenditure and receipt figures for the year 2020-21 were released. The year 2020-21 presented a two-fold challenge for states – loss in revenue due to impact of COVID-19 pandemic and lockdown, and the need for increased expenditure to support affected persons and economic recovery. CAG noted that Uttar Pradesh’s GSDP grew by 1.05% in 2020-21 as compared to a growth of 6.5% in 2019-20. The state reported a revenue deficit of Rs 2,367 crore in 2020-21 after reporting revenue surplus for 14 successive years since 2006-07. Revenue deficit is the excess of revenue expenditure over revenue receipts. This blog looks at the key trends in the finances of Uttar Pradesh in 2020-21 and certain observations by CAG on fiscal management by the state.
Spending and Deficits in 2020-21
Underspending: In 2020-21, total spending by the state was 26% less than the budget estimate presented in February 2020. In sectors such as water supply and sanitation, the actual expenditure was 60% less than the amount budgeted, while in agriculture and allied activities only 53% of the budgeted amount was spent. CAG observed that in 251 schemes across 57 departments, the state government did not incur any expenditure in 2020-21. These schemes had a budget provision of at least one crore rupees, and had cumulative allocation of Rs 50,617 crore. These included schemes such as Pipe Drinking Water Scheme in Bundelkhand/Vindhya and apportionment of pension liabilities. Moreover, the overall savings due to non-utilisation of funds in 2020-21 was 27.28% of total budget provisions. CAG observed that the budgetary provisions increased between 2016 and 2021. However, the utilisation of budget provisions reduced between 2018-19 and 2020-21.
Pattern of spending: CAG observed that in case of 12 departments, more than 50% of the expenditure was incurred in March 2021, the last month of the financial year. In the civil aviation department, 89% of the total expenditure was incurred in March while this figure was 62% for the social welfare department (welfare of handicapped and backward classes). CAG noted that maintaining a steady pace of expenditure is a sound practice under public financial management. However, the Uttar Pradesh Budget Manual has no specific instructions for preventing such bunching of expenditure. The CAG recommended that the state government can consider issuing guidelines to control the rush of expenditure towards the closing months of the financial year.
Management of deficit and debt: As a measure to mitigate the impact of COVID-19, an Ordinance was promulgated in June 2020 to raise the fiscal deficit limit from 3% of GSDP to 5% of GSDP for the year 2020-21. Fiscal deficit represents the gap between expenditure and receipts in a year, and this gap is filled with borrowings. The Uttar Pradesh Fiscal Responsibility and Budget Management Act, 2004 (FRBM Act) passed by Uttar Pradesh Assembly specifies the upper limit for debt and deficits. The Ordinance thus permitted the state government to borrow more to sustain its budget expenditure. The fiscal deficit of the state in 2020-21 was 3.20% of GSDP, well below the revised limit. At the same time, the state’s outstanding debt to GSDP in 2020-21 was 32.77% of GSDP, above the target of 32% of GSDP set under the FRBM Act. Outstanding debt represents accumulation of debt over the years.
Table 1: Spending by Uttar Pradesh in 2020-21 as compared to Budget Estimates (in Rs crore)
|
Particular |
2020-21 BE |
2020-21 Actuals |
% change from BE to Actuals |
|
Net Receipts (1+2) |
4,24,767 |
2,97,311 |
-30% |
|
1. Revenue Receipts (a+b+c+d) |
4,22,567 |
2,96,176 |
-30% |
|
a. Own Tax Revenue |
1,58,413 |
1,19,897 |
-24% |
|
b. Own Non-Tax Revenue |
31,179 |
11,846 |
-62% |
|
c. Share in central taxes |
1,52,863 |
1,06,687 |
-30% |
|
d. Grants-in-aid from the Centre |
80,112 |
57,746 |
-28% |
|
Of which GST compensation grants |
7,608 |
9,381 |
23% |
|
2. Non-Debt Capital Receipts |
2,200 |
1,135 |
-48% |
|
3. Borrowings |
75,791 |
86,859 |
15% |
|
Of which GST compensation loan |
- |
6,007 |
- |
|
Net Expenditure (4+5+6) |
4,77,963 |
3,51,933 |
-26% |
|
4. Revenue Expenditure |
3,95,117 |
2,98,543 |
-24% |
|
5. Capital Outlay |
81,209 |
52,237 |
-36% |
|
6. Loans and Advances |
1,637 |
1,153 |
-30% |
|
7. Debt Repayment |
34,897 |
26,777 |
-23% |
|
Revenue Balance |
27,451 |
-2,367 |
-109% |
|
Revenue Balance (as % of GSDP) |
1.53% |
-0.14% |
|
|
Fiscal Deficit |
53,195 |
54,622 |
3% |
|
Fiscal Deficit (as % of GSDP) |
2.97% |
3.20% |
Note: A negative revenue balance indicates a deficit. The actual fiscal deficit reported by Uttar Pradesh for 2020-21 in 2022-23 budget was 2.8% of GSDP. This difference was due to higher GSDP figure reported by the state.
Sources: Uttar Pradesh Budget Documents of various years; CAG; PRS.
Finances of State Public Sector Undertakings
Public sector undertakings (PSUs) are set up by the government to discharge commercial activities in various sectors. As on March 31, 2021, there were 115 PSUs in Uttar Pradesh. CAG analysed the performance of 38 PSUs. Out of these 38 PSUs, 22 companies earned a profit of Rs 700 crore, while 16 companies posted a loss of Rs 7,411 crore in 2020-21. Note that both the number of PSUs incurring losses and the quantum of losses has decreased since 2018-19. In 2018-19, 20 PSUs had reported losses worth Rs 15,219 crore.
Figure 1: Cumulative losses incurred by Uttar Pradesh PSUs (Rs crore)

Sources: CAG; PRS.
Losses of power sector PSUs: Three power sector PSUs—Uttar Pradesh Power Corporation Limited, Purvanchal Vidyut Vitran Nigam Limited, and Paschimanchal Vidyut Vitran Nigam Limited—were the top loss incurring PSUs. These three PSUs accounted for 73% of the total losses of Rs 7,411 crore mentioned above. Note that as of June 2022, for each unit of power supplied, the revenue realised by UP power distribution companies (discoms) is 27 paise less than cost of supply. This is better than the gap of 34 paise per unit at the national level. However, the aggregate technical and commercial losses (AT&C) of the Uttar Pradesh discoms was 27.85%, considerably higher than the national average of 17.19%. AT&C losses refer to the proportion of power supplied by a discom for which it does not receive any payment.
Off-budget borrowings: CAG also observed that the Uttar Pradesh government resorted to off-budget borrowing through state owned PSUs/authorities. Off budget borrowings are not accounted in the debt of the state government and are on books of the respective PSUs/authorities, although, debt is serviced by the state government. As a result, the outstanding debt reported in the budget does not represent the actual debt position of the state. CAG identified off-budget borrowing worth Rs 1,637 crore. The CAG recommended that the state government should avoid extra-budget borrowings. It should also credit all the loans taken by PSUs/authorities on behalf of and serviced by the state government to state government accounts.
Management of Reserve Funds
The Reserve Bank of India manages two reserve funds on the behalf of state governments. These funds are created to meet the liabilities of state governments. These funds are: (i) Consolidated Sinking Fund (CSF), and (ii) Guarantee Redemption Fund (GRF). They are funded by the contributions made by the state governments. CSF is an amortisation fund which is utilised to meet the repayment obligations of the government. Amortisation refers to payment of debt through regular instalments. The interest accumulated in the fund is used for repayment of outstanding liabilities (which is the accumulation of total borrowings at the end of a financial year, including any liabilities on the public account).
In line with the recommendation of the 12th Finance Commission, Uttar Pradesh created its CSF in March 2020. The state government may transfer at least 0.5% of its outstanding liabilities at the end of the previous year to the CSF. CAG observed that in 2020-21, Uttar Pradesh appropriated only Rs 1,000 crore to the CSF against the requirement of Rs 2,454 crore. CAG recommended that the state government should ensure at least 0.5% of the outstanding liabilities are contributed towards the CSF every year.
GRF is constituted by states to meet obligations related to guarantees. The state government may extend guarantee on loans taken by its PSUs. Guarantees are contingent liabilities of the state government, as in case of default by the company, repayment burden will fall on the state government. GRF can be used to settle guarantees extended by the government with respect to borrowings of state PSUs and other bodies. The 12th Finance Commission had recommended that states should constitute GRF. It was to be funded through guarantees fees to meet any sudden discharge of obligated guarantees extended by the states. CAG noted that Uttar Pradesh government has not constituted GRF. Moreover, the state has also not fixed any limits for extending guarantees.
For an analysis of Uttar Pradesh’s 2022-23 budget, please see here.

